UCLA Scientists Use Remote Sensing to Track Methane Plumes from the Aliso Canyon Blowout That Traveled Over Six Miles Downwind

A new UCLA-led study has revealed how far the methane plumes from the 2015–2016 Aliso Canyon gas blowout spread across Los Angeles County. Using a combination of satellite imagery, airborne sensors, and ground monitors, the research team reconstructed the path and intensity of methane emissions during the 112-day disaster, confirming that the plumes likely traveled at least 6.2 miles downwind into nearby residential areas like Porter Ranch.
The study, published in Environmental Research Communications (2025), provides one of the most detailed looks yet at how methane gas from underground storage can move through the atmosphere during large-scale leaks. It also reaffirms previous estimates that the blowout released nearly 100,000 metric tons of methane—about 20% of California’s annual methane emissions and double the typical emission rate for the Los Angeles Basin.
How the Aliso Canyon Blowout Began
The disaster began on October 23, 2015, when a well known as SS-25 ruptured at the Aliso Canyon Natural Gas Storage Facility, located north of Los Angeles in the Santa Susana Mountains. Methane—a powerful greenhouse gas—began escaping uncontrollably from an underground reservoir used by SoCalGas to store natural gas.
Over the next few months, the leak spewed millions of cubic feet of methane per day, forcing thousands of residents from their homes. The event finally ended on February 11, 2016, after engineers successfully sealed the well. By then, it had become the largest uncontrolled release of natural gas in U.S. history, displacing more than 8,000 households and sparking major regulatory reforms.
The Aim of the New Study
The new research, led by UCLA’s Aliso Canyon Disaster Health Research Study team, aimed to answer a crucial question: how far did the methane plumes travel, and how might that have affected people living nearby?
Before the team could properly study potential health impacts, they needed a clear picture of how the methane moved during the event. Understanding the shape, reach, and concentration of the plumes helps scientists estimate how many residents might have been exposed—and at what levels.
To accomplish this, the researchers turned to remote sensing, a powerful method that uses satellite and airborne instruments to detect gases in the atmosphere.
How Scientists Tracked the Methane
The study combined multiple layers of data to map the plumes’ behavior.
1. Satellite Data:
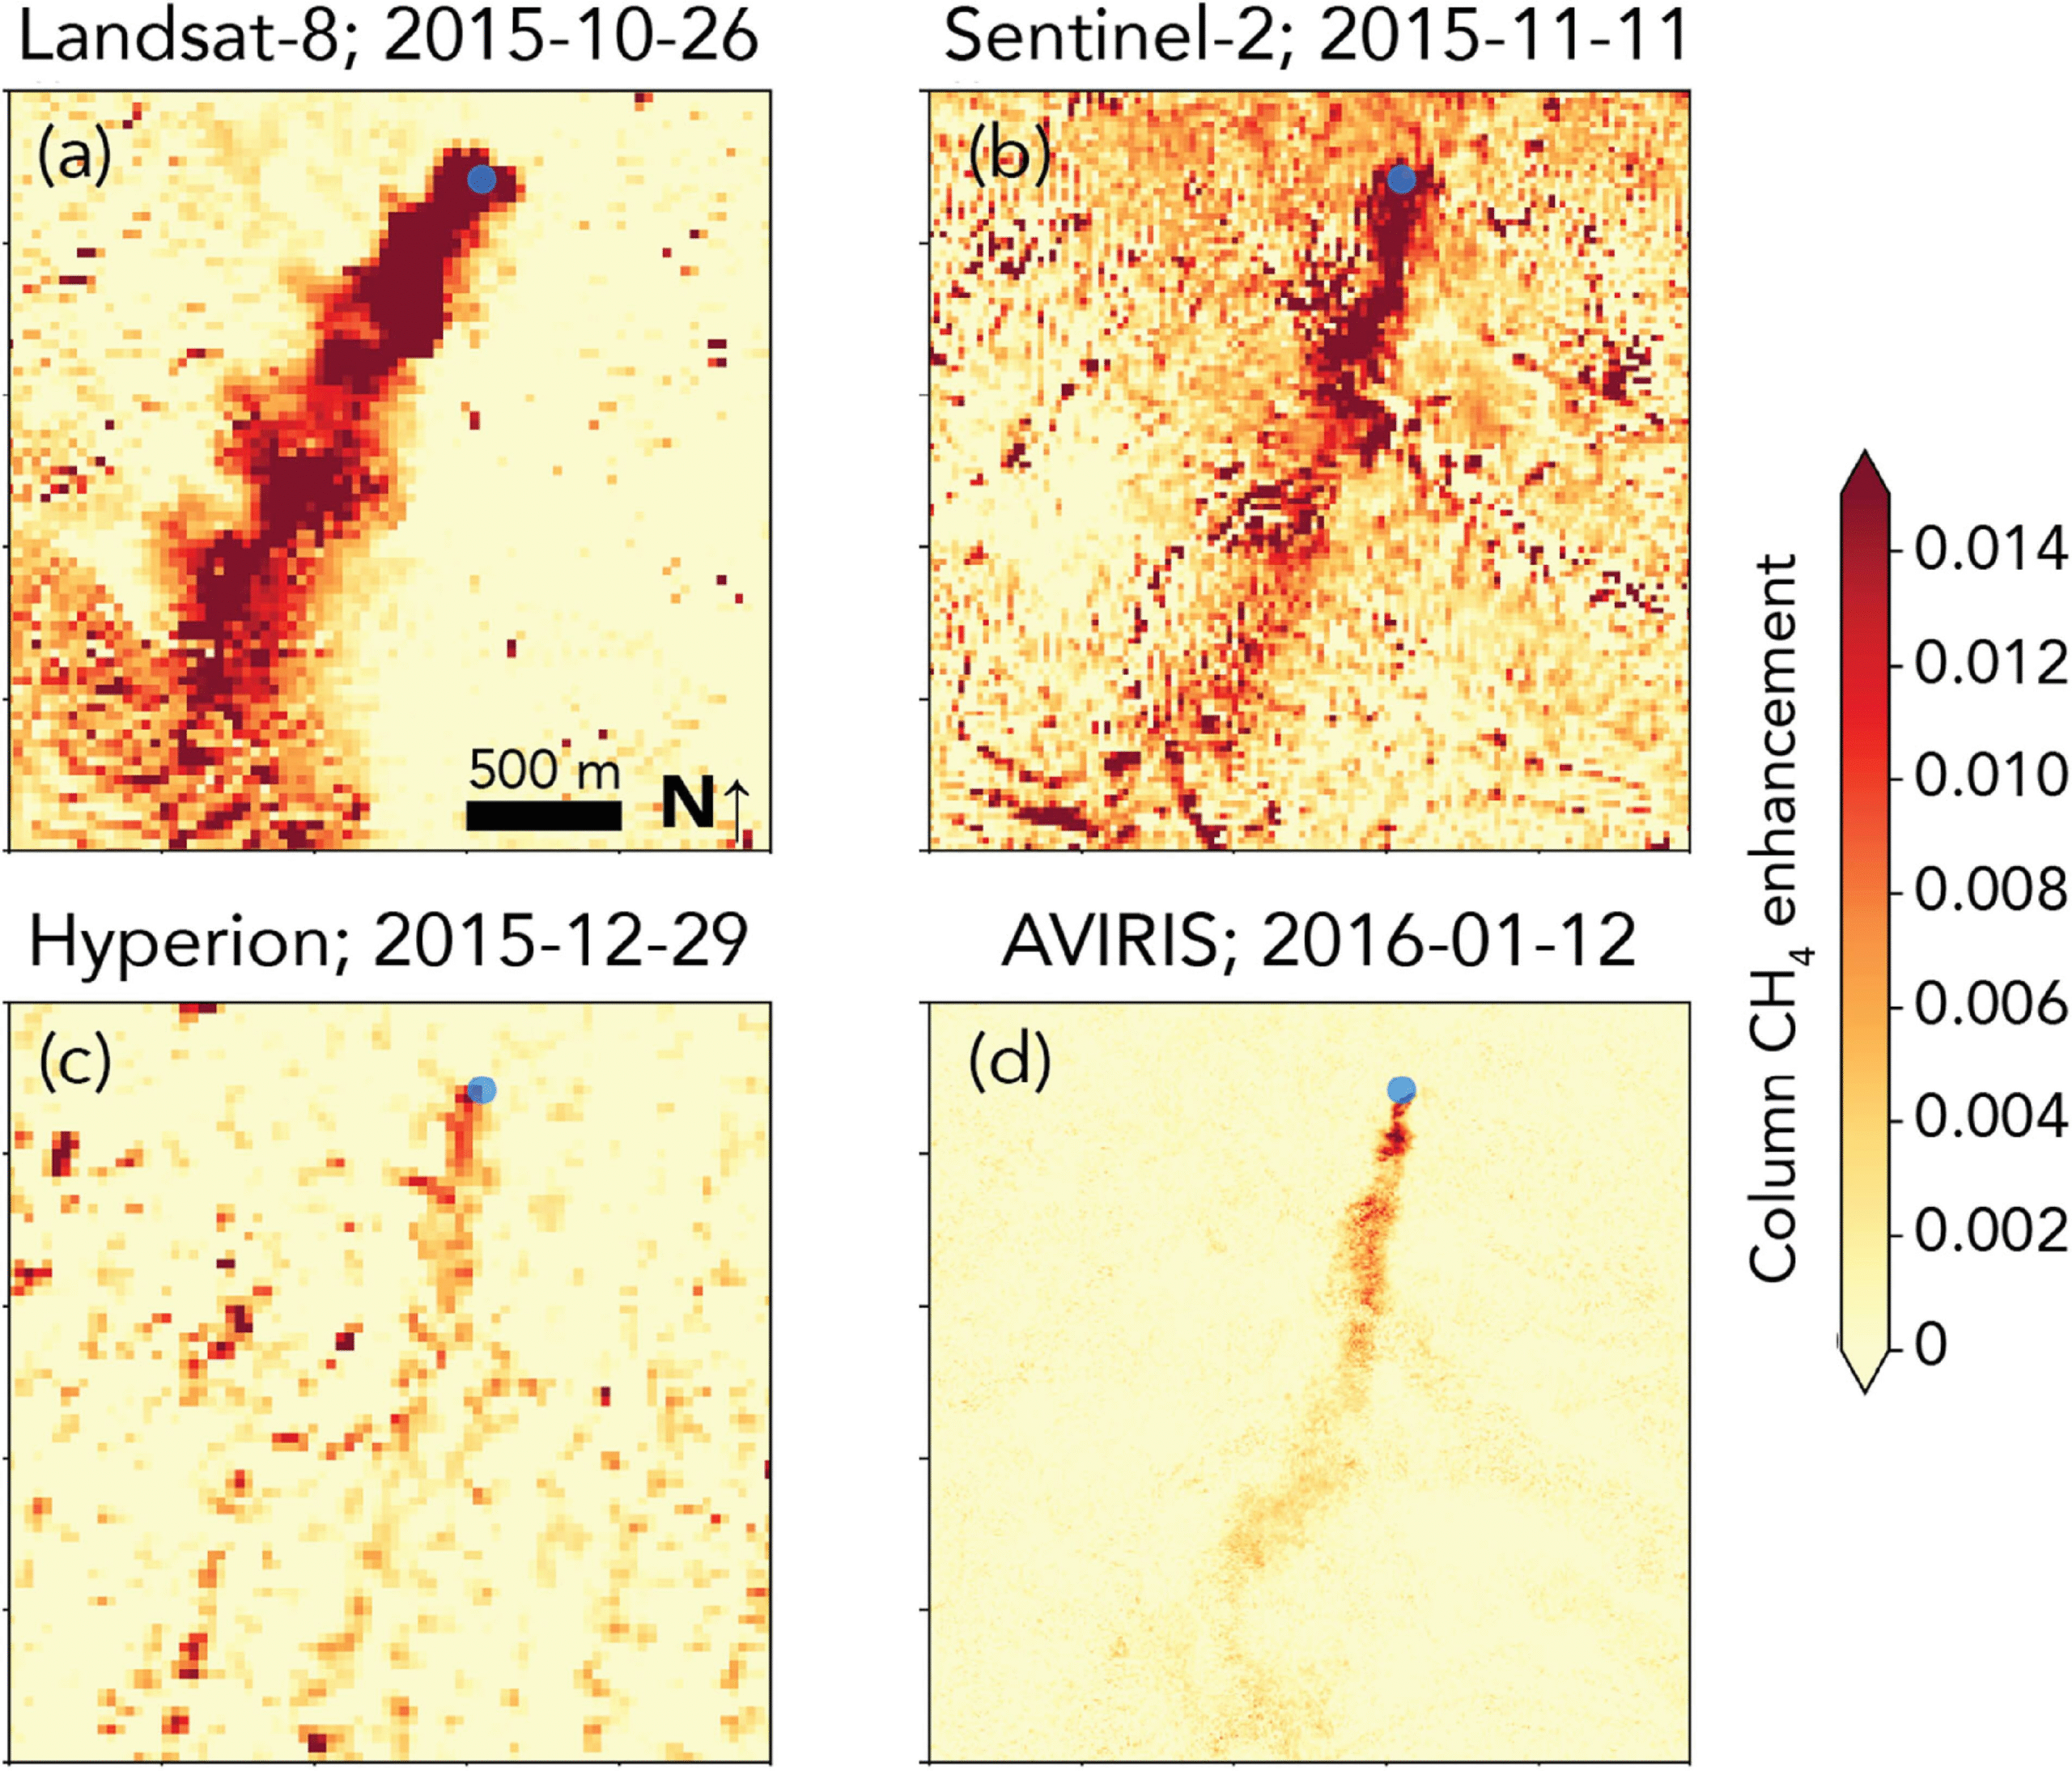
The team analyzed cloud-free images from the Landsat-8 and Sentinel-2 satellites to observe the early stages of the disaster. These satellites provided wide-area views of methane concentrations, revealing where the gas had accumulated and how it was moving downwind from the leak site.
Later in the blowout, they added imagery from the Hyperion satellite—which can capture more detailed spectral information—and from an aircraft equipped with AVIRIS (Airborne Visible/Infrared Imaging Spectrometer). AVIRIS data helped identify the exact intensity and spread of methane over time.
2. Ground Measurements:
To validate what the satellites were showing, the scientists used data from the California Air Resources Board (CARB). CARB had installed two ground-based monitors in the community surrounding the Aliso Canyon facility. These devices recorded hourly methane concentrations from December 2015 through March 2016.
By matching these ground readings with satellite and airborne observations taken at the same times, the researchers could correlate atmospheric methane levels with conditions on the ground.
What the Study Found
The results were striking. The methane plumes were shown to travel at least 6.2 miles (around 10 kilometers) downwind into residential areas such as Porter Ranch. In some cases, depending on wind and weather, enhanced methane levels were observed as far as 14 kilometers (about 8.7 miles) from the source.
This confirmed that the reach of the blowout was significantly wider than previously thought. The findings also reinforced earlier emission estimates of around 100,000 metric tons of methane released over the four-month period.
Researchers emphasized that the downwind distance and plume intensity are essential factors for understanding potential exposure risks among local residents. Without this mapping, it would be far harder to connect environmental data with possible health outcomes.
Why It Matters
This study provides a critical foundation for ongoing investigations into the short- and long-term health effects of the Aliso Canyon disaster. UCLA’s health research team is now using this exposure data to better understand how the blowout may have impacted people’s respiratory health, mental well-being, and even pregnancy outcomes.
In fact, a separate UCLA study in 2025 reported that women who were in their third trimester of pregnancy during the blowout had an almost 50% higher risk of delivering low birth-weight babies compared to typical rates. This suggests that even communities miles away from the leak site experienced measurable effects.
Methane’s Broader Environmental Impact
Methane is a potent greenhouse gas, trapping about 84 times more heat than carbon dioxide over a 20-year period. When massive amounts escape—like those from Aliso Canyon—it can seriously undermine climate goals.
Globally, methane leaks come from many sources: natural gas infrastructure, agriculture (especially livestock), and landfills. According to the Intergovernmental Panel on Climate Change (IPCC), cutting methane emissions is one of the fastest ways to slow the pace of global warming in the short term.
Events like Aliso Canyon show how infrastructure failures can create massive climate setbacks in just a few weeks. The blowout alone temporarily doubled methane emissions from the entire Los Angeles Basin.
Lessons and Technological Advances
Beyond documenting a specific disaster, the study showcases how modern remote sensing technology can be used to monitor environmental crises in real time. The ability to combine satellite, airborne, and ground-based data gives scientists a far clearer view of what’s happening in the atmosphere.
This approach can be applied to other methane leaks, industrial accidents, or even natural events like thawing permafrost and wetland emissions. The researchers stress that having multiple observation platforms is key—each provides a different scale and resolution, and together they build a comprehensive picture of what’s really going on.
It’s also a reminder that cloud-free satellite conditions are essential for accurate measurements. The team had to carefully match satellite images with clear weather windows to ensure reliable data collection.
What’s Next for Aliso Canyon
The Aliso Canyon site remains under scrutiny. Although operations eventually resumed under stricter safety standards, the event continues to serve as a case study in disaster preparedness, infrastructure monitoring, and community health research.
Local residents have long called for the facility’s permanent closure, arguing that no level of risk is acceptable near populated neighborhoods. Meanwhile, scientists are using the lessons learned from this disaster to develop better methods for detecting leaks early, reducing emissions, and protecting nearby communities.
The researchers behind this study hope their work will guide both policy changes and future emergency responses, ensuring that when the next leak occurs—whether in California or elsewhere—we’ll be able to identify, measure, and mitigate it far more effectively.
Research Reference:
Daniel Cusworth et al. Characterization of methane plumes during the Aliso Canyon natural gas leak: a remote sensing perspective. Environmental Research Communications (2025). https://doi.org/10.1088/2515-7620/ae108b


