How a New Dataset Reveals the Real Story of Food Access After Hurricane Harvey

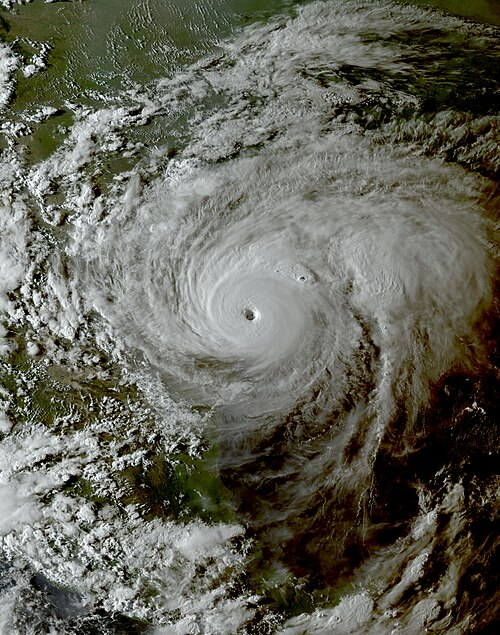
The impact of Hurricane Harvey in August 2017 is often described in terms of rainfall records, catastrophic flooding, and widespread damage across Texas and Louisiana. But one dimension that rarely receives the same level of attention is what happens to food access after such a massive disaster.
A newly recognized dataset, now awarded the 2025 NHERI DesignSafe Dataset Award, offers one of the most detailed looks ever compiled on how retail food stores and charitable food providers struggled — and eventually recovered — after Harvey. This dataset, titled PRJ-2769 | Food Access Impact Survey for Harris County and Southeast Texas after Hurricane Harvey in 2017, was built through extensive field research and reveals exactly how supply chains, infrastructure, and local food networks behaved under extreme pressure.
This article breaks down every specific detail from the news report, while also expanding on why these findings matter, how food systems respond to disasters, and what they teach us about building more resilient communities.
What the Dataset Covers and Why It Matters
The award-winning dataset was led by Nathanael Rosenheim, a research associate professor in the Department of Landscape Architecture and Urban Planning at Texas A&M University, alongside collaborators Maria Watson (University of Florida), John Patrick Casellas Connors, Mastura Safayet, and Walter Peacock (Texas A&M University). Their work focuses on three counties that suffered the worst flooding from Harvey: Harris, Jefferson, and Orange counties in Southeast Texas.
What makes this dataset so significant is its scope and structure. It includes:
- Direct interviews with 210 food retailers
- Interviews with 32 food aid agencies, such as food pantries
- Geographically linked information about each retailer’s location
- A nutrition environment survey capturing product availability before and after Harvey
- Additional data on many other food retailers in the region that were not interviewed directly
The research team used this information to uncover the factors that influenced how quickly or slowly food access was restored in different areas. The findings help emergency managers, urban planners, and food system researchers understand where the weak points are — and how to build more resilient systems for future disasters.
How the Data Was Collected
Collecting this level of detail required an enormous on-the-ground effort. A group of 15 graduate students rented cars and drove across Southeast Texas to conduct face-to-face interviews in places such as Orange, Beaumont, Port Arthur, and Houston. Out of a sample of 3,000 stores, the team attempted to reach about 500 and collected as much field data as possible.
For each store, they performed a nutrition environment survey to document which food products were available both before and after the hurricane. This included tracking essentials like fresh produce, dairy, bread, refrigerated items, and other foods that require stable infrastructure to stock and store.
These surveys revealed significant variation between store types. Large grocery stores have broad selection and extensive refrigeration, while convenience stores offer a much narrower range of foods. These structural differences influenced how quickly each type of store could return to normal operations — or if they could at all.
What Disrupted Food Access After Harvey
Several major issues emerged as key disruptors of food access:
1. Widespread Building Damage
Flooding caused significant structural damage to many food retailers and pantries. Damaged buildings led to extended closures and limited services even after floodwaters receded.
2. Electricity Loss
Without power, refrigeration and freezers fail. This directly impacts fresh food availability, making electricity loss one of the most harmful disruptions for food access.
3. Staff Shortages
Retailers and charitable food agencies saw shortages as employees evacuated, were displaced, or dealt with personal emergencies.
4. Supply Chain Disruptions
Road closures, fuel shortages, and transportation system failures all played a part in slowing deliveries. Even stores that could open often could not restock fresh items quickly.
What the Researchers Learned
The findings revealed something striking: looking only at store closures and property damage severely underestimates how long communities faced limited access to fresh food. According to the researchers, the real reduction in access lasted nearly two weeks longer than traditional measures would indicate.
This insight matters because emergency food planners often rely on store reopening data to determine when a community has recovered. But a store can be open without being able to provide fresh food, and that’s a critical difference in terms of nutrition, health, and community resilience.
The research also shows how disasters intensify the existing interdependence between food retailers and food pantries. When stores lose stock or cannot operate, demand for charitable food services spikes. Meanwhile, these same pantries are also dealing with their own supply and infrastructure challenges. Understanding these interactions is key to creating coordinated disaster responses.
The Role of DesignSafe and High-Performance Computing
The dataset is archived on NHERI DesignSafe, the cyberinfrastructure platform managed at UT Austin and the Texas Advanced Computing Center (TACC). With tools like Python, Jupyter notebooks, and Stata, the research team ran extensive models on the Lonestar6 supercomputer to analyze the data.
The DesignSafe platform allowed the researchers to store large quantities of information, track versions of the dataset over several years, and maintain detailed metadata so every contributor is credited. This long-term archiving ensures consistency in models, transparency in methods, and accessibility for future research.
Why This Dataset Received an Award
The 2025 DesignSafe Dataset Award recognizes research datasets that advance natural hazards research. This dataset stands out because of:
- Its impressive scale involving hundreds of direct interviews
- Its geographic detail linking responses to exact store locations
- Its integration of multiple systems, including supply chains, infrastructure, and staffing
- Its long-term continuity, with nearly 10 years of data management since the project began after Harvey
- Its clear value for planners, policymakers, emergency managers, and researchers
The dataset does more than document one disaster — it helps create tools for future disaster response and recovery planning in any major metropolitan region.
The Bigger Picture: Food Systems and Disaster Recovery
Food access is shaped by a complex web of infrastructure, supply chains, and human resources. A hurricane that knocks out power or floods roads doesn’t just close a store; it disrupts every part of the system behind it.
This research is part of a broader effort to develop a decision platform that integrates computational models for interdependent systems such as:
- Transportation
- Energy
- Water
- Food systems
Understanding how each system fails — and recovers — helps predict what communities will face and how long vulnerabilities will last.
This type of modeling is essential for resilient urban planning, especially as climate-related extreme weather events become more frequent.
What This Means for the Future
The biggest takeaway is that restoring food access isn’t simply about flipping the lights back on at a grocery store. True recovery requires restoring infrastructure, stabilizing supply chains, supporting staff, and reinforcing both commercial retailers and community food aid systems.
For cities preparing for future disasters, this dataset provides a roadmap to identify vulnerable areas, estimate recovery timelines, and plan more strategically for food resource assistance.
Research Reference
Food Access After Disasters — Journal of the American Planning Association (2024)
https://doi.org/10.1080/01944363.2023.2284160


